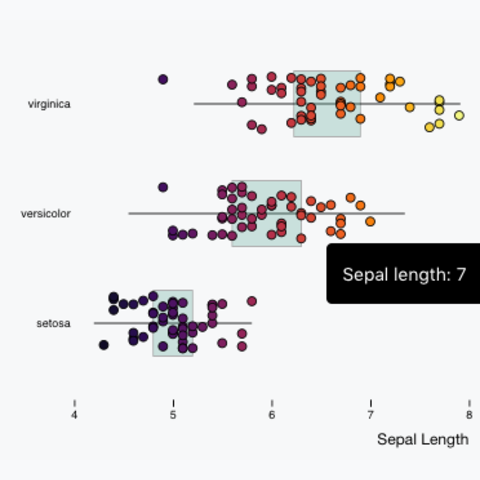
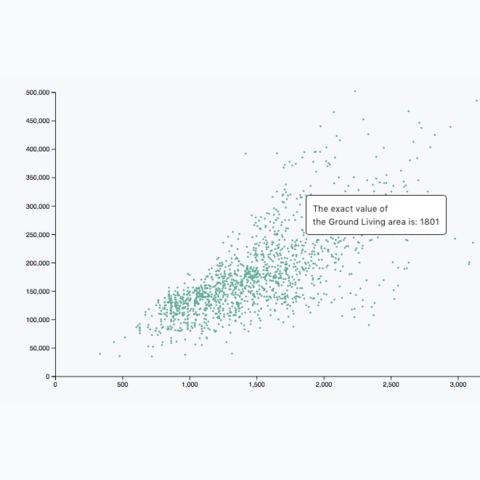
Examples
A set of d3.js chart examples with reproducible code that use the tooltip concepts described above:
This is document gives a few insights on how to add tooltips with d3.js. It is composed by several interactive examples, allowing to play with the code to understand better how it works.
.svg. Note that it would work the same with any type of svg element.div is added, with a bit of text in it and a few features. It is actually the tooltip! But it is hidden is css with visibility: hidden.<!DOCTYPE html>
<meta charset="utf-8">
<!-- Load d3.js -->
<script src="https://d3js.org/d3.v4.js"></script>
<!-- Create a div where the graph will take place -->
<div id="my_dataviz"></div>
<script>

// Start by creating the svg area
var svg = d3.select("#my_dataviz")
  .append("svg")
    .attr("width", 400)
    .attr("height", 400)

// Append a circle
svg.append("circle")
  .attr("id", "circleBasicTooltip")
  .attr("cx", 150)
  .attr("cy", 200)
  .attr("r", 40)
  .attr("fill", "#69b3a2")

// create a tooltip
var tooltip = d3.select("#my_dataviz")
  .append("div")
    .style("position", "absolute")
    .style("visibility", "hidden")
    .text("I'm a circle!");

//
d3.select("#circleBasicTooltip")
  .on("mouseover", function(){return tooltip.style("visibility", "visible");})
  .on("mousemove", function(){return tooltip.style("top", (event.pageY-800)+"px").style("left",(event.pageX-800)+"px");})
  .on("mouseout", function(){return tooltip.style("visibility", "hidden");});

</script> htmlhtml element in your tooltip. Thus, absolutely any customization is doable.<!DOCTYPE html>
<meta charset="utf-8">
<!-- Load d3.js -->
<script src="https://d3js.org/d3.v4.js"></script>
<!-- Create a div where the graph will take place -->
<div id="div_customContent"></div>
<script>

// Start by creating the svg area
var svg_customContent = d3.select("#div_customContent")
  .append("svg")
    .attr("width", 400)
    .attr("height", 400)

// Append a circle
svg_customContent.append("circle")
  .attr("id", "circleCustomTooltip")
  .attr("cx", 150)
  .attr("cy", 200)
  .attr("r", 40)
  .attr("fill", "#69b3a2")

// create a tooltip
var tooltip2 = d3.select("#div_customContent")
  .append("div")
    .style("position", "absolute")
    .style("visibility", "hidden")
    .style("background-color", "white")
    .style("border", "solid")
    .style("border-width", "1px")
    .style("border-radius", "5px")
    .style("padding", "10px")
    .html("<p>I'm a tooltip written in HTML</p><img src='https://github.com/holtzy/D3-graph-gallery/blob/master/img/section/ArcSmal.png?raw=true'></img><br>Fancy<br><span style='font-size: 40px;'>Isn't it?</span>");


d3.select("#circleCustomTooltip")
  .on("mouseover", function(){return tooltip2.style("visibility", "visible");})
  .on("mousemove", function(){return tooltip2.style("top", (event.pageY-2390)+"px").style("left",(event.pageX-800)+"px");})
  .on("mouseout", function(){return tooltip2.style("visibility", "hidden");});

</script> event.pageX or d3.select(this)Two different functions allow to recover the mouse position and use it to control the tooltip position.
event.pageX() and event.pageY(). Recover the mouse position when the event happens. Used in the above example. Code looks like that:
      tooltip
        .style("top", (event.pageY)+"px")
        .style("left",(event.pageX)+"px")
Note that you can add a numeric value next to event.pageX or Y to adjust the tooltip position
d3.select(this) is the second option. It selects the element that is hovered. Thus, it is possible to get whatever attribute or style of this element, like its position. If the element is a circle, you can get the cx attribute, which is the horizontal positioning.
      tooltip
        .style("top", d3.select(this).attr("cy") + "px");
        .style("left", d3.select(this).attr("cx") + "px")
d3.mouse(this) another option. Not sure of the differences with 2 others above.
      tooltip
        .style("top",  (d3.mouse(this)[1]) + "px")
        .style("left", (d3.mouse(this)[0]) + "px")
Note: It can sometimes be quite a pain to position tooltips if you have a complex layout in your webpage. For instance, this post uses the bootstrap framework to build columns. Thus the event.pageY() position must be corrected.
ToDo: Dig here to understand this problem more in depth
<!DOCTYPE html>
<meta charset="utf-8">

<!-- Load d3.js & plugin-->
<script src="https://d3js.org/d3.v4.js"></script>
<script src="https://d3js.org/d3-scale-chromatic.v1.min.js"></script>

<!-- Create a div where the graph will take place -->
<div id="div_template"></div>
<script>

// set the dimensions and margins of the graph
var margin = {top: 20, right: 25, bottom: 30, left: 40},
  width = 450 - margin.left - margin.right,
  height = 450 - margin.top - margin.bottom;

// append the svg object to the body of the page
var svg = d3.select("#div_template")
.append("svg")
  .attr("width", width + margin.left + margin.right)
  .attr("height", height + margin.top + margin.bottom)
.append("g")
  .attr("transform",
        "translate(" + margin.left + "," + margin.top + ")");

//Read the data
d3.csv("https://raw.githubusercontent.com/holtzy/D3-graph-gallery/master/DATA/heatmap_data.csv", function(data) {

  // Labels of row and columns -> unique identifier of the column called 'group' and 'variable'
  var myGroups = d3.map(data, function(d){return d.group;}).keys()
  var myVars = d3.map(data, function(d){return d.variable;}).keys()

  // Build X scales and axis:
  var x = d3.scaleBand()
    .range([ 0, width ])
    .domain(myGroups)
    .padding(0.05);
  svg.append("g")
    .style("font-size", 15)
    .attr("transform", "translate(0," + height + ")")
    .call(d3.axisBottom(x).tickSize(0))
    .select(".domain").remove()

  // Build Y scales and axis:
  var y = d3.scaleBand()
    .range([ height, 0 ])
    .domain(myVars)
    .padding(0.05);
  svg.append("g")
    .style("font-size", 15)
    .call(d3.axisLeft(y).tickSize(0))
    .select(".domain").remove()

  // Build color scale
  var myColor = d3.scaleSequential()
    .interpolator(d3.interpolateInferno)
    .domain([1,100])

  // create a tooltip
  var Tooltip = d3.select("#div_template")
    .append("div")
    .style("opacity", 0)
    .attr("class", "tooltip")
    .style("background-color", "white")
    .style("border", "solid")
    .style("border-width", "2px")
    .style("border-radius", "5px")
    .style("padding", "5px")

  // Three function that change the tooltip when user hover / move / leave a cell
  var mouseover = function(d) {
    Tooltip
      .style("opacity", 1)
    d3.select(this)
      .style("stroke", "black")
      .style("opacity", 1)
  }
  var mousemove = function(d) {
    Tooltip
      .html("The exact value of<br>this cell is: " + d.value)
      .style("left", (d3.mouse(this)[0]+70) + "px")
      .style("top", (d3.mouse(this)[1]) + "px")
  }
  var mouseleave = function(d) {
    Tooltip
      .style("opacity", 0)
    d3.select(this)
      .style("stroke", "none")
      .style("opacity", 0.8)
  }


  // add the squares
  svg.selectAll()
    .data(data, function(d) {return d.group+':'+d.variable;})
    .enter()
    .append("rect")
      .attr("x", function(d) { return x(d.group) })
      .attr("y", function(d) { return y(d.variable) })
      .attr("rx", 4)
      .attr("ry", 4)
      .attr("width", x.bandwidth() )
      .attr("height", y.bandwidth() )
      .style("fill", function(d) { return myColor(d.value)} )
      .style("stroke-width", 4)
      .style("stroke", "none")
      .style("opacity", 0.8)
    .on("mouseover", mouseover)
    .on("mousemove", mousemove)
    .on("mouseleave", mouseleave)
})

</script> A set of d3.js chart examples with reproducible code that use the tooltip concepts described above: