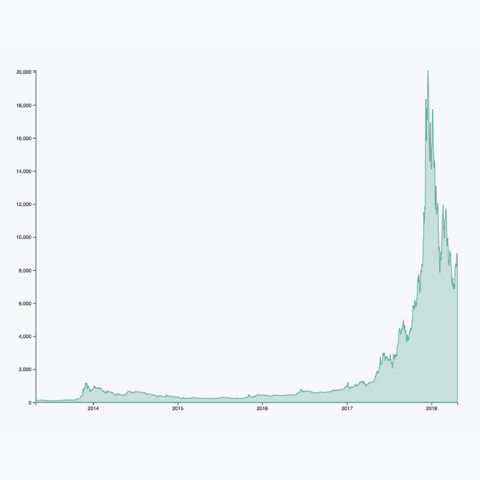
Most basic
The most basic area chart you can do in d3.js. Keeping only the core code.
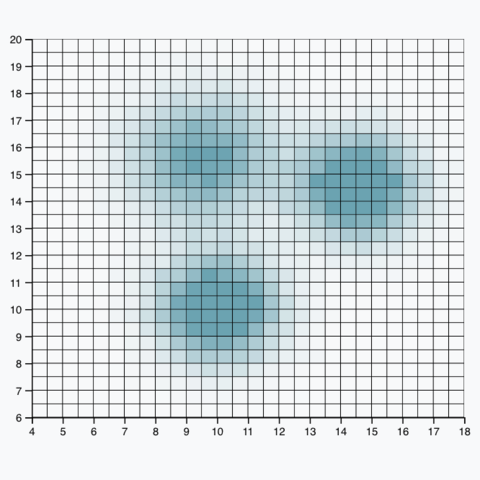
2d histogram
Group two-dimensional points into rectangular bins. Possible thanks to the d3-rectbin plugin.
d3-rectbin
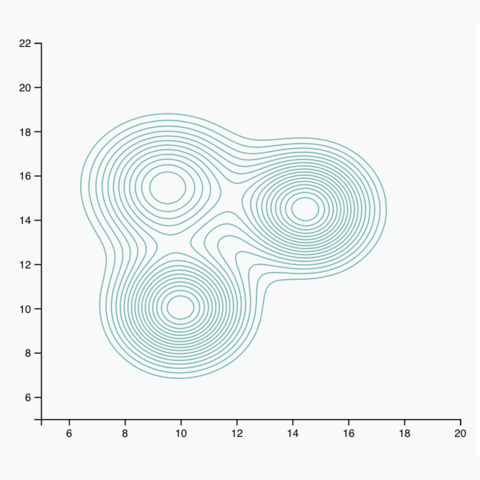
Contour plot
Representation of contour polygons computed using marching squares
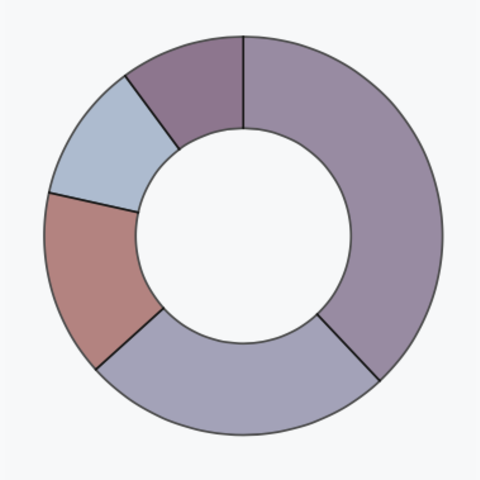
The most basic donut chart you can do in d3.js. Keeping only the core code.
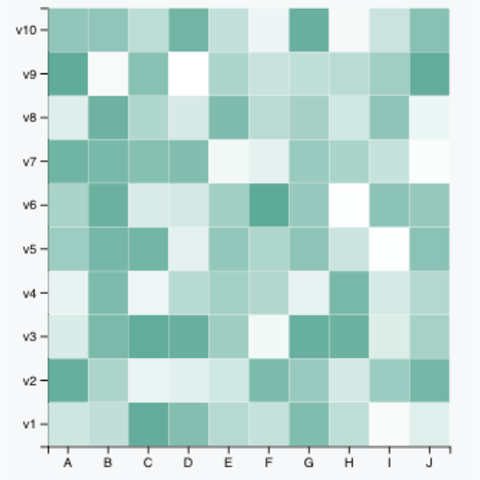
The most basic heatmap you can do in d3.js. Keeping only the core code.
Add tooltip to heatmap
Add a tooltip that displays the exact value of a cell and whatever other text.
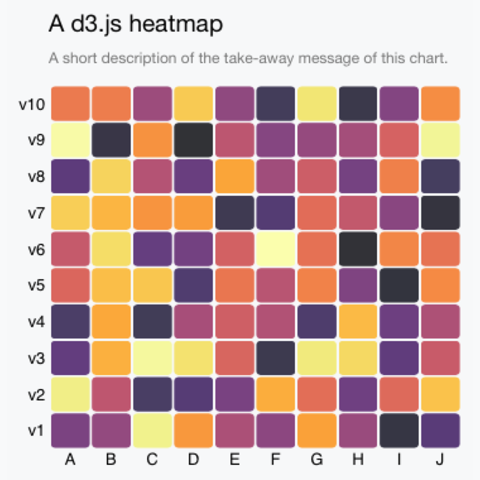
Ready to go heatmap
A customized heatmap, include hover effect, custom axis, title, fancy color palette, tooltip and more
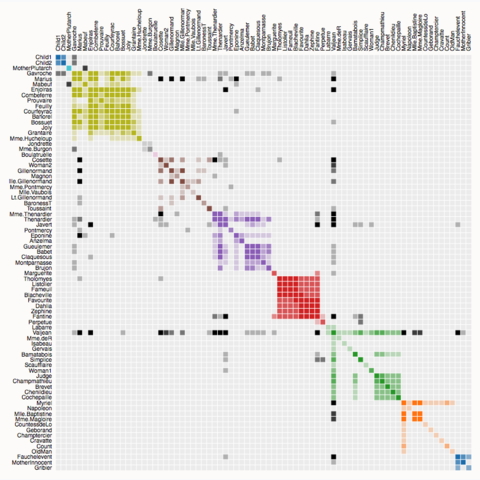
Visualization of Les Misérables
Interactive heatmap with possible switch in group order
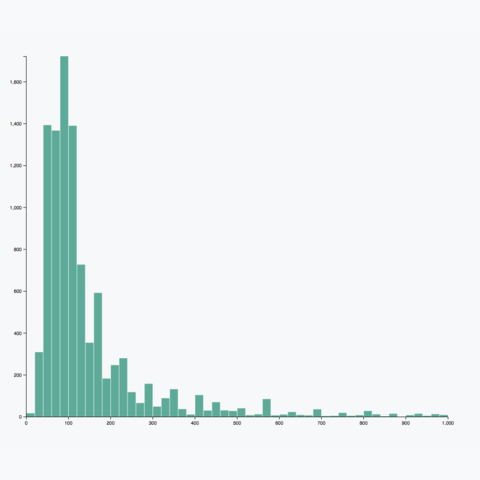
The most basic histogram you can do in d3.js. Keeping only the core code.
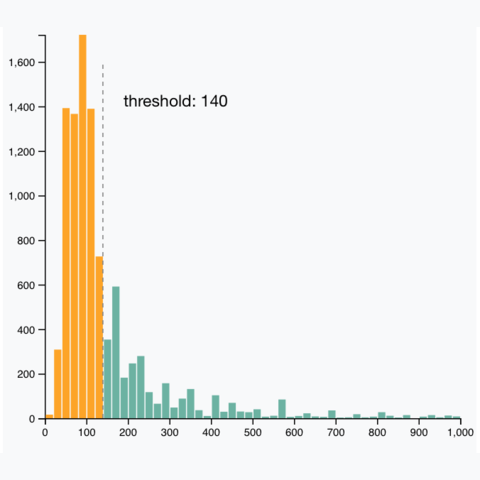
Color a specific part
Use a simple if - else statement to color a part of the histogram.Also show how to add a vertical bar annotation.
if - else
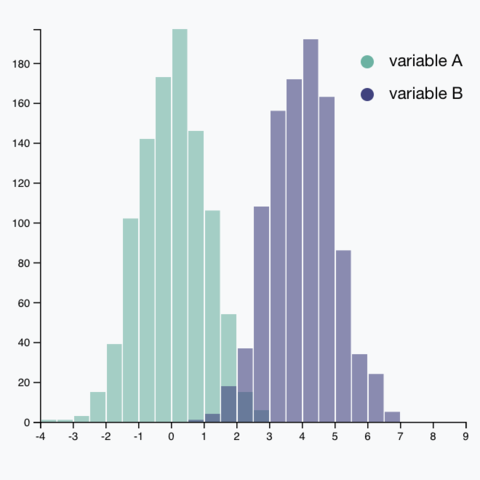
Double histogram
A double histogram can be handy to compare the distribution of 2 variables.Good to see how the filter() function works.
filter()
Button to control bin size
Add a button that controls bin size. Good example to learn how to create an update function that also update an axis.
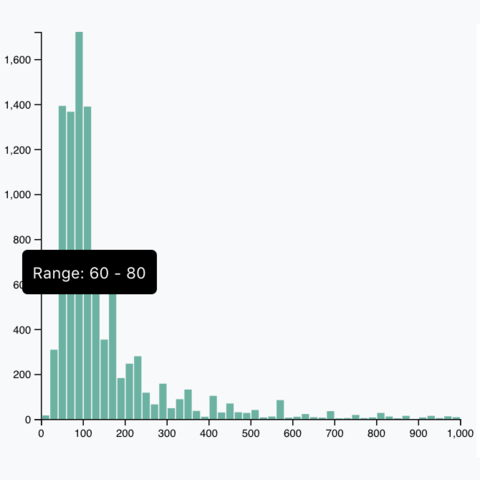
Add tooltip
Useful to get the threshold of each bar range. Needs to be improved though.
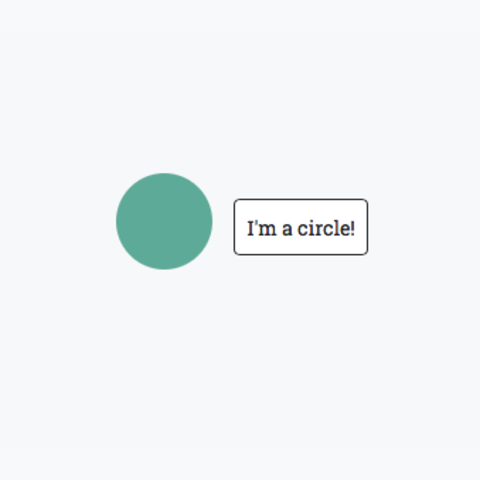
The most basic tooltip you can do in d3.js.It just create one tooltip for one circle
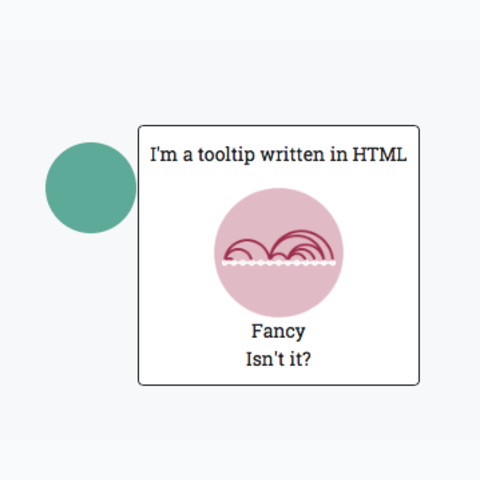
HTML in tooltip
Learn how to customize your tooltip: you can apply any html code to it!
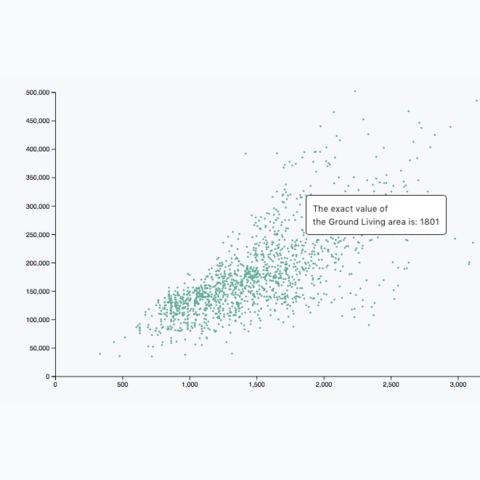
Tooltip linked with data
This example shows how to create a tooltip that is different for each datapoint
Brushing
How to apply brushing on a chart to select dots.
HTML button types
HTML natively offers different types of button: here is a description of them with the associated code.
The most basic transition you can do in d3.js.It just modify the width attribute of a div using d3.js, keeping only the core code.
Pipe several transition
Run several transitions one after another. Involves different attributes like color and width.
Progressive transition
This example applies a different delay to each element. It gives a progressive transition where elements start moving one by one.
delay
The most basic line chart you can do in d3.js. Keeping only the core code.
Several groups
Learn how to represent several groups on the line plot. This requires to group the data using the d3.nest function.
Transition between input data
Add a button that allows to go from one dataset to another with a smooth transition. Useful to understand how to build a update() function.
update()
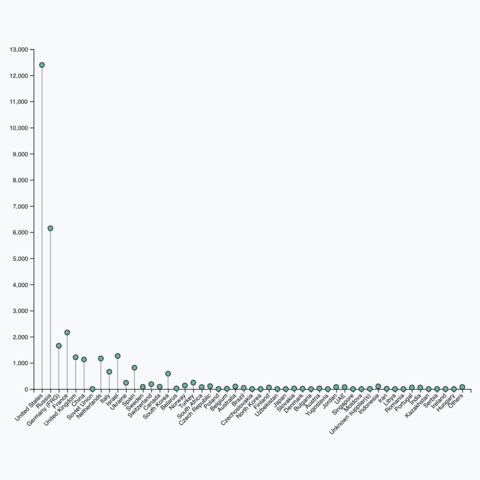
The most basic lollipop chart you can do in d3.js. Keeping only the core code.
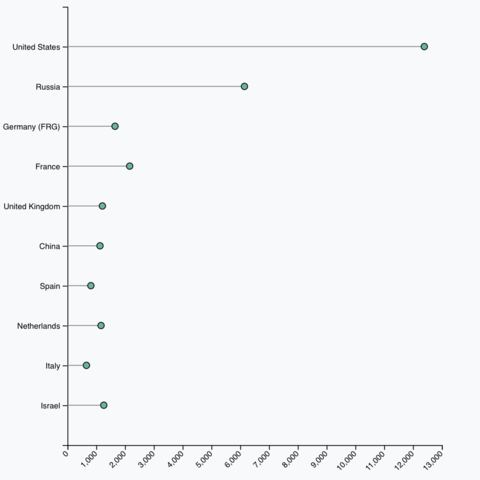
Turn it horizontal
Lollipop plot often looks better horizontal: it makes label easier to be read. Find how to do it!
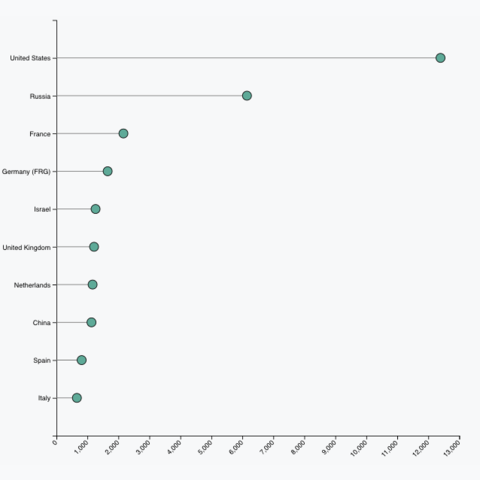
Order groups
Give more insight to your chart: reorder groups with just 3 more lines of code.
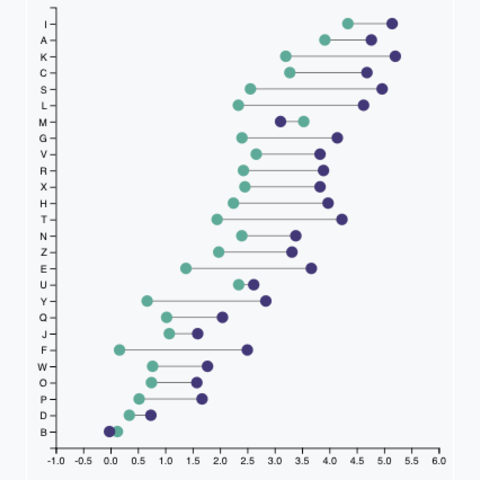
Cleveland dot plot
A variation of the lollipop where 2 data series are available for each group.
Basic animation at loading
Points start at x=0 and then take their real position.
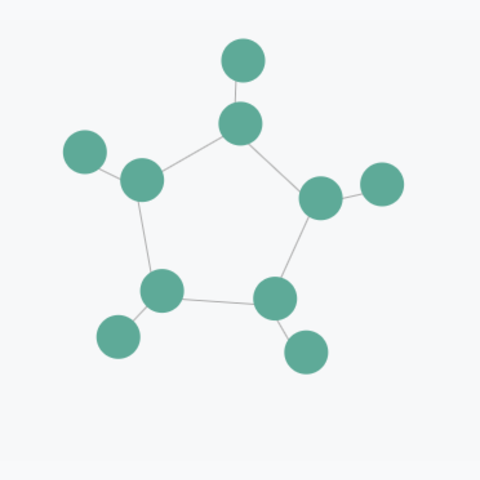
The most basic network graph you can do in d3.js. Keeping only the core code.Input format: Json
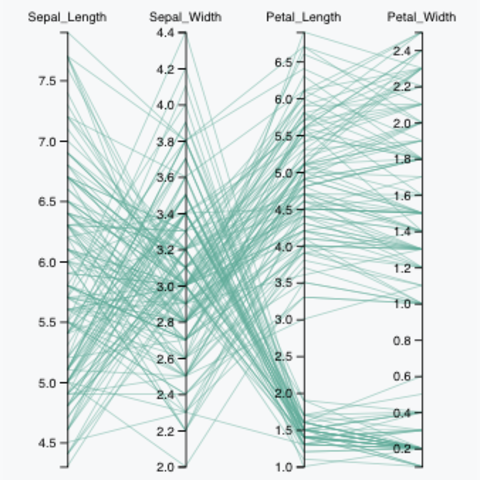
The most basic Parallel Coordinates chart you can do in d3.js. Keeping only the core code.
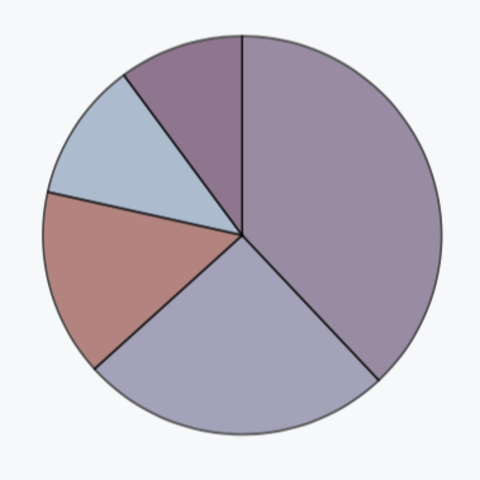
The most basic pie chart you can do in d3.js. Keeping only the core code.
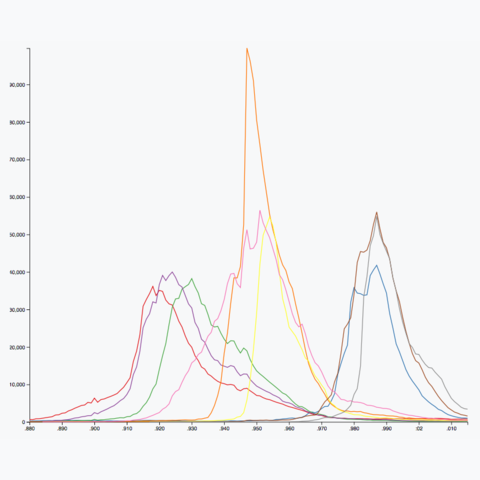
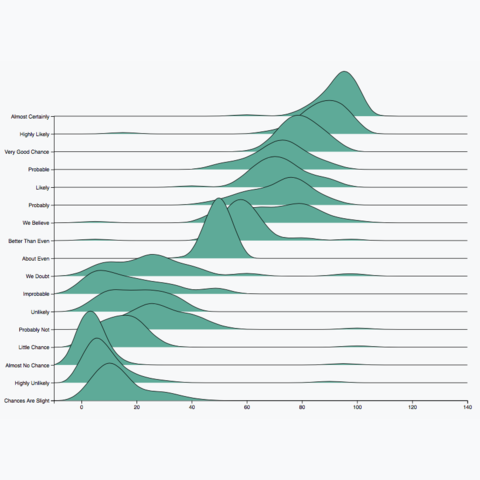
The most basic ridgeline chart you can do in d3.js. Keeping only the core code.
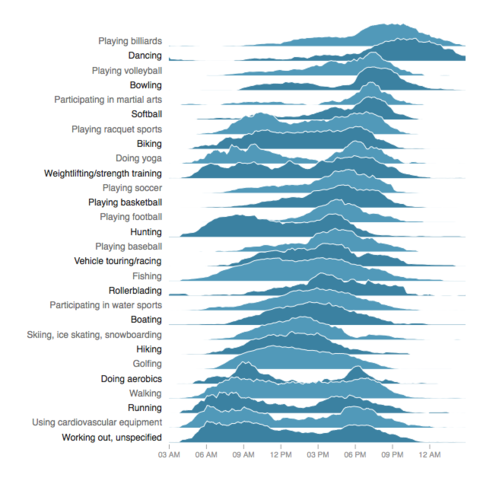
Pick time of day for sports
A good looking ridgeline plot by Andrew Mollica showing the umber of participants for a few sports throughout the day.
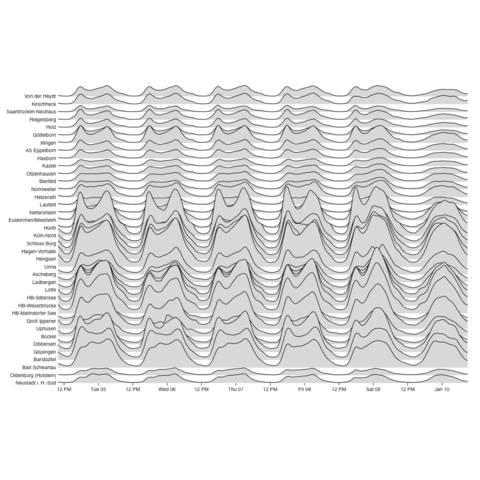
Ridge line or Joy plot
An implementation by Mike Bostock. Use d3.v5. It is an observable notebooks -> even better.
The most basic sankey diagram you can do in d3.js. Keeping only the core code.Input data format: Json
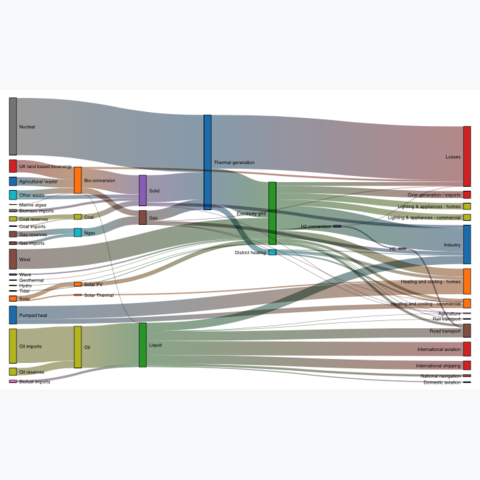
Energy production flow
UK energy production and consumption in 2050: energy supplies are on the left, and demands are on the right
The most basic scatterplot you can do in d3.js. Keeping only the core code.
Add tooltips
Add a tooltip that appears beside each datapoint when you hover it
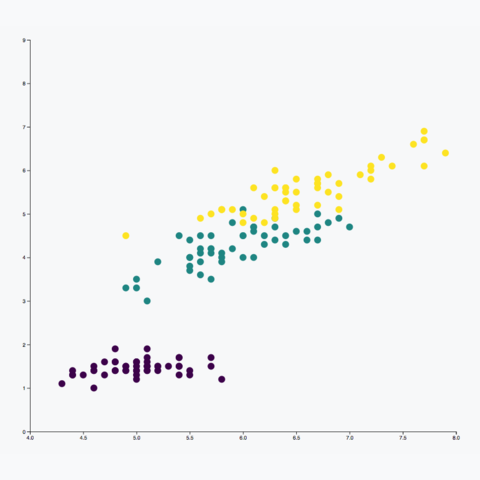
Basic grouped scatterplot: each group has a different color.
Highlight a group
Highlight a group of point when one of its member is hovered
Animation at start
Make the dots appear one after the other using a different delay for each.
Brush
Learn how to allow brushing, and how to modify points in the brush area
Update X axis limits
A button control the X axis upper limit and trigger a smooth transition to the new limit
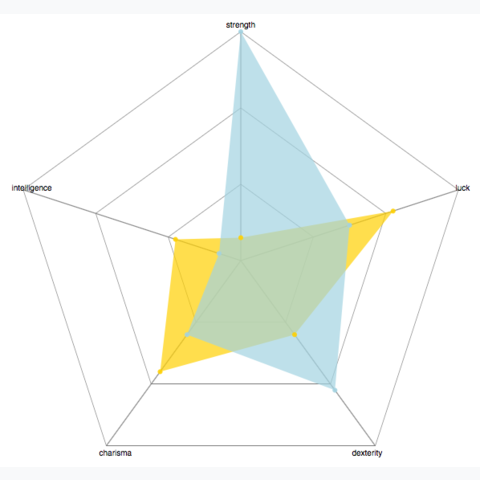
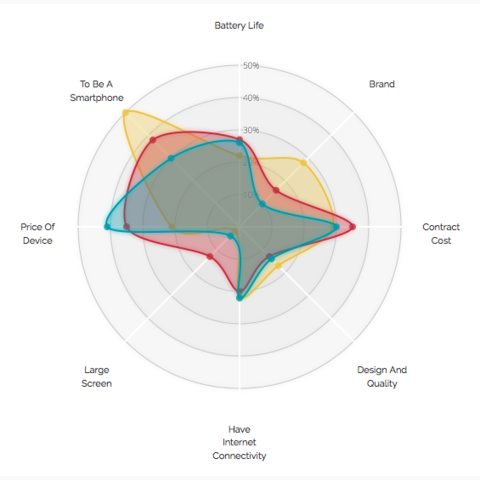
Initial radar chart function
Alvaro Graves was the first building a function for radar chart.Click to visit the github repo and find a few examples.
Radar Chart Redesign
Nadieh Bremer revisited the previous chart with a more straightforward code and a different look.
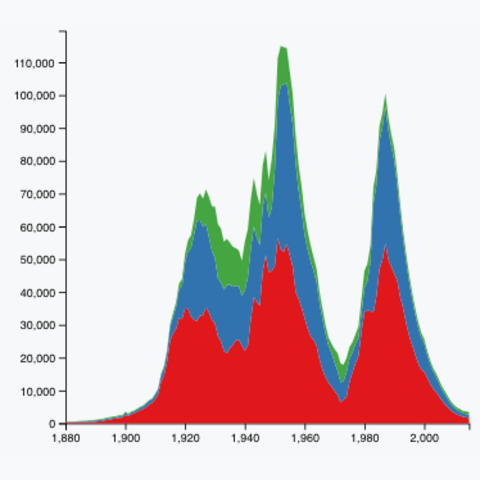
Basic from long input
The most basic stacked area chart you can do in d3.js. Keeping only the core code.Input format:long (tidy)
Basic from wide input
Another basic stacked area chart made in d3.js.Note that here the input format is wide (untidy): each group is provided in a specific column.
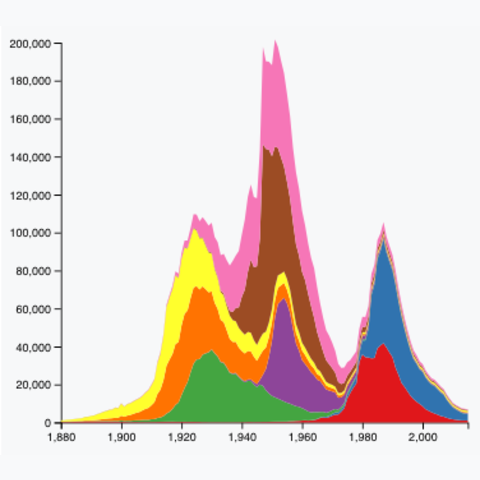
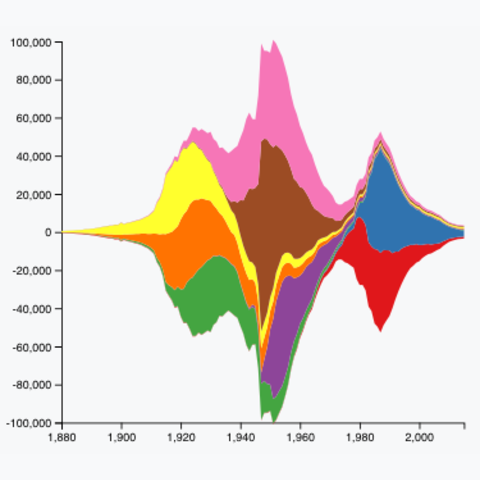
The most basic streamgraph you can do in d3.js. Keeping only the core code.Input format: wide (untidy)
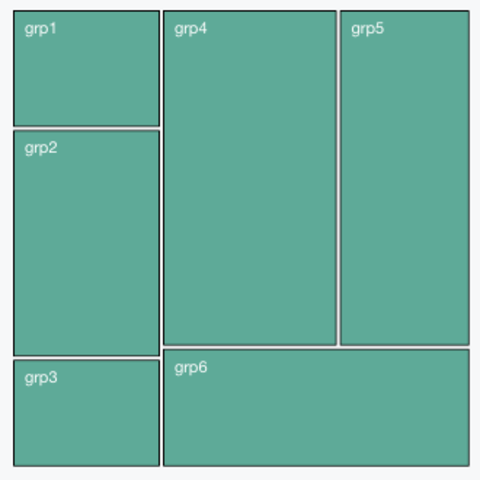
The most basic treemap you can do in d3.js. Only one level of a hierarchy is represented.Input: csv format
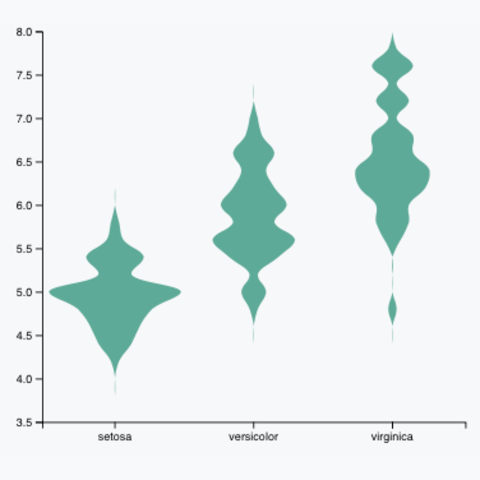
Violin chart
Here a smoothing function is used to transformed the mirror histogram in a violin plot.
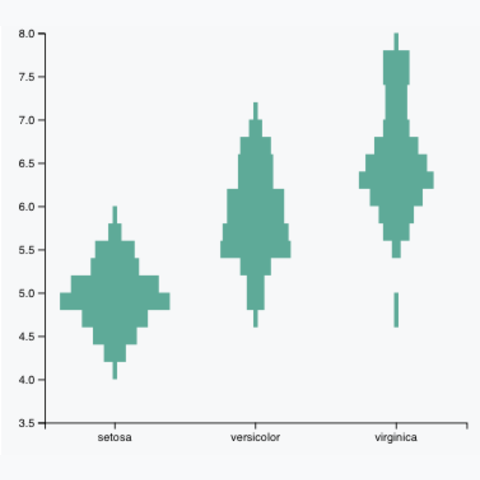
Variation: no smoothing
A variation of the previous chart without any smoothing
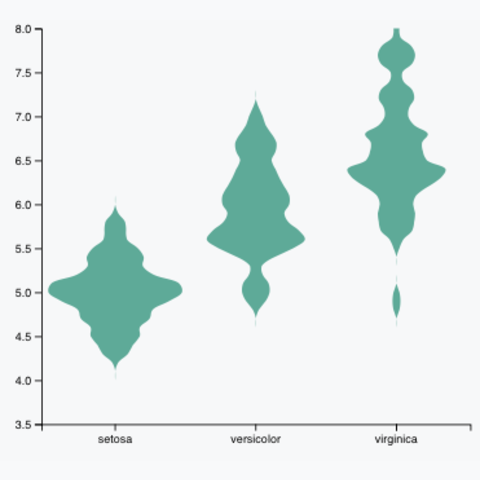
Variation: show steps
Here the curveStep function is used to interpolate values: it reveals the underlying histogram structure.
The most basic violin chart you can do in d3.js. Keeping only the core code.
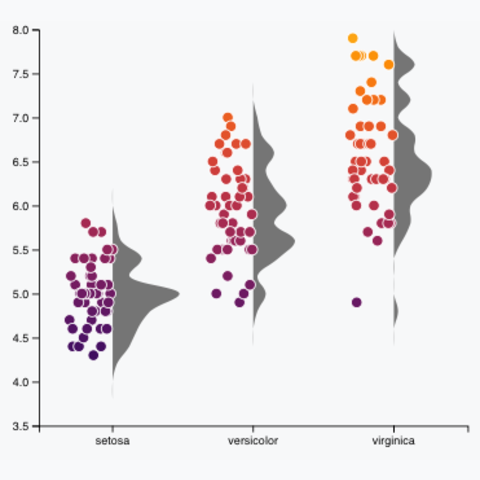
Violin with jitter
Half of the violin is removed to show the single observations. Jittering is used to avoid dots overlap.
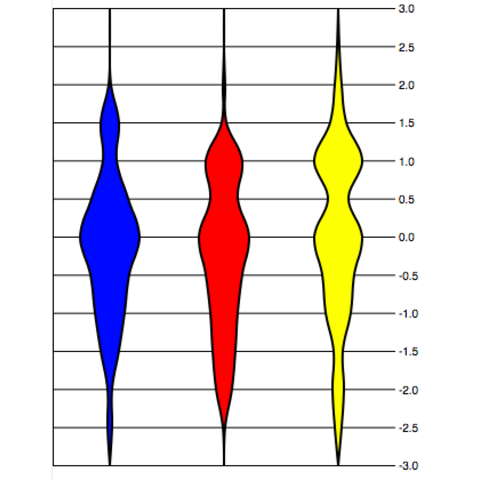
Violin Chart
Short code building a violin chart from 3 dummy arrays.
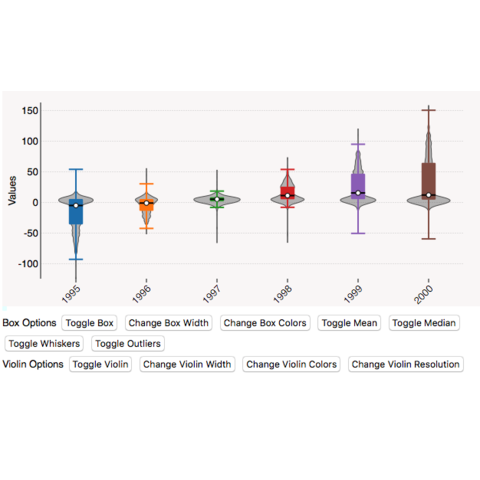
Violin + boxplot
Implementation by Andrew Sielen, with button to understand how to custom each part of the char.
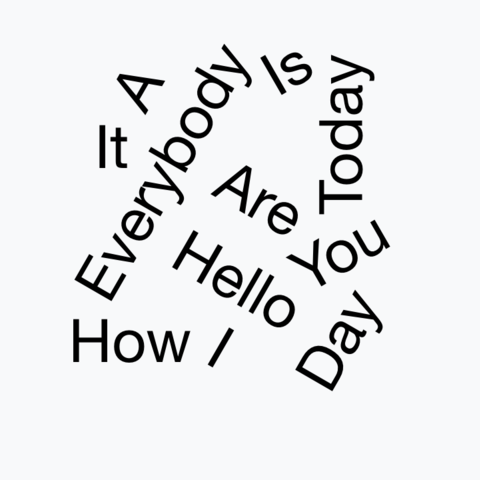
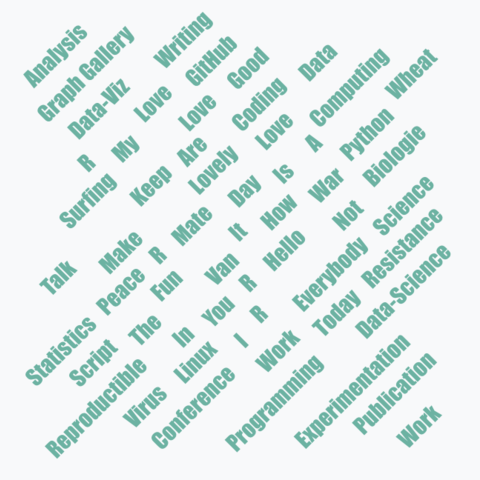
The most basic wordcloud you can do in d3.js. It calls the d3-cloud plugin without any argument.Input data: vector written in code
d3-cloud
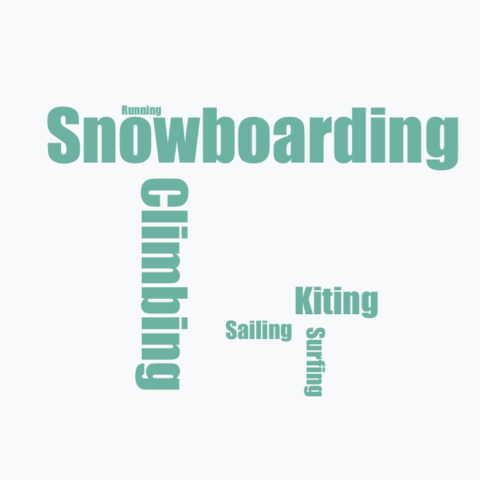
General customization
Apply basic customization to the wordcloud: color, angles, font, size and more.Input data: vector written in code
Proportional size
This post will teach you how to make the word size proportional to their occurrence.Input data: vector written in code