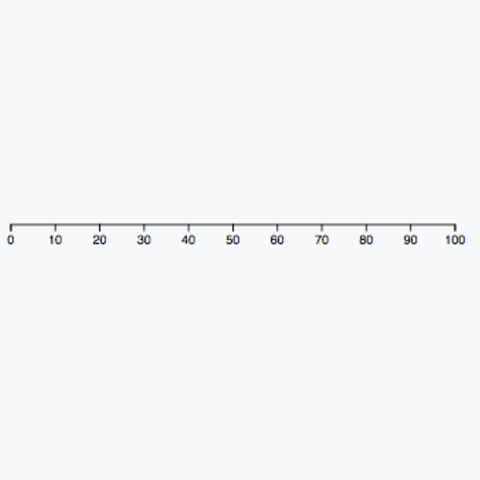
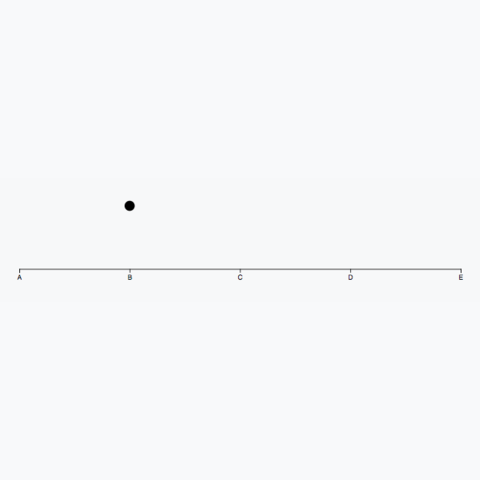
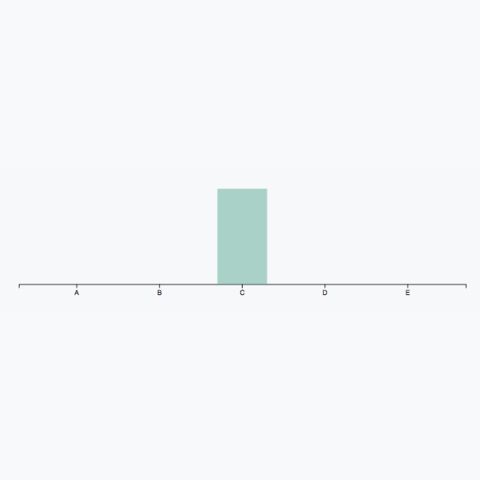
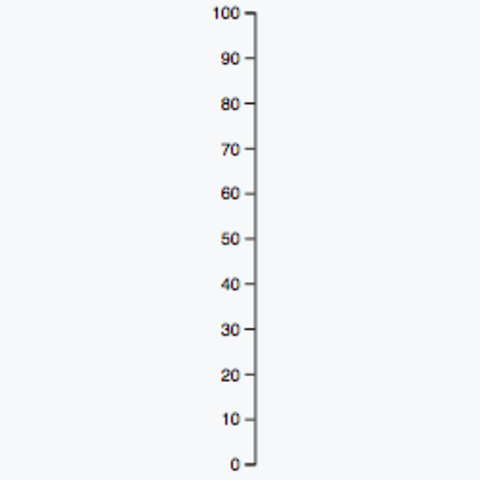
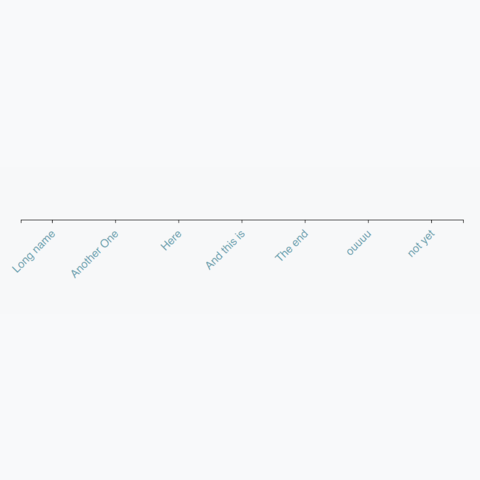
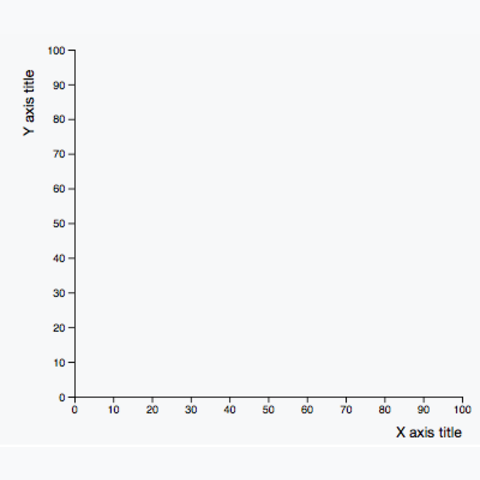
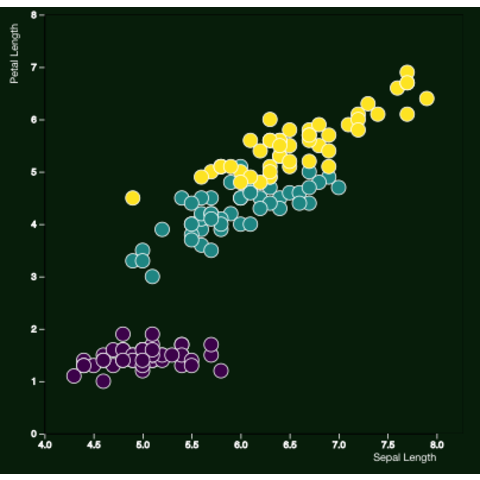
D3.js offers built-in function to add axis to your chart. The first
step is to build a scale that allows to transform a
numeric value to a coordinate on the plot. The second is to call
axisBottom() or axisLeft() to build the
axis. Browse the example below to understand the different
types of existing scale, how to build axis and how to
customize them.
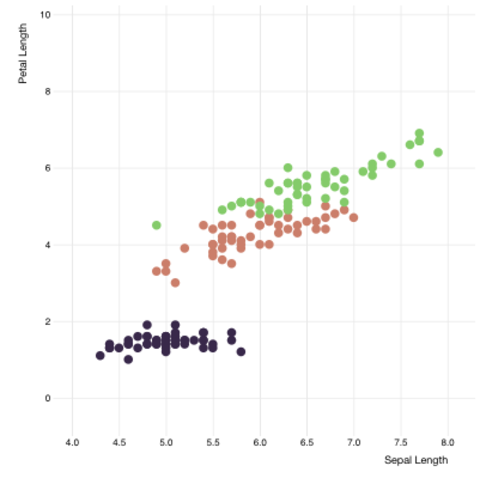
A post on the basic of color management with d3.js. You will learn how to call a color, how to build different types of color palette and how to map them to your dataset.


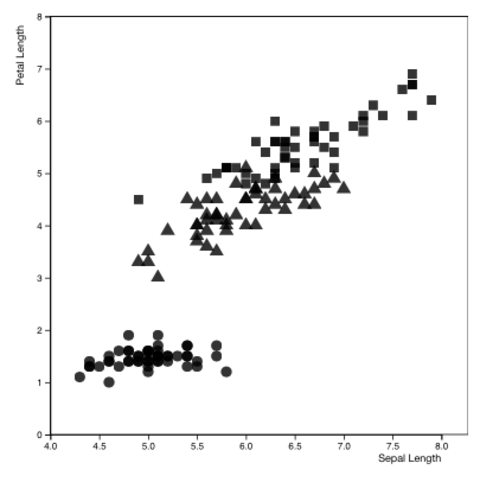
A post that provides a few theme templates inspired from famous other libraries like ggplot2 or ipsum.

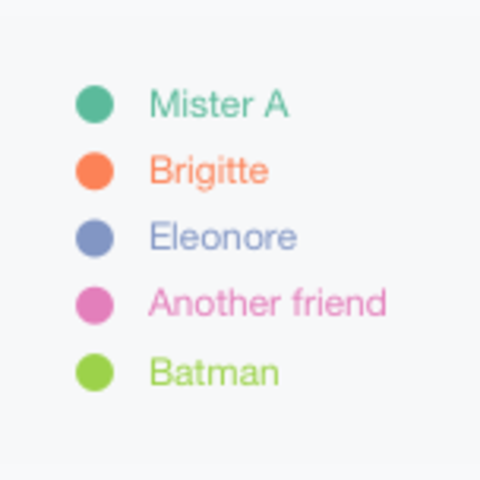
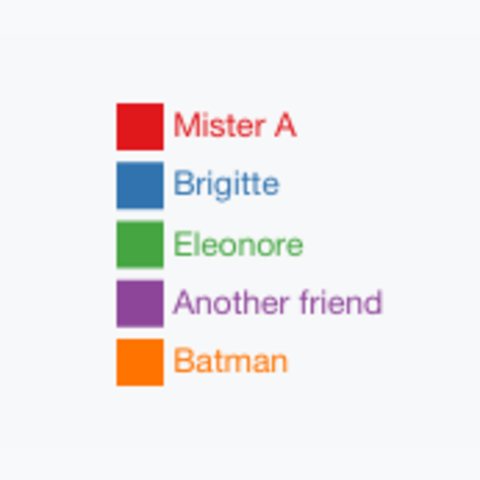
A few examples for legends, always with the d3.js code ready to be copied and pasted.
A post on the basics of responsiveness with d3.js. Try to change your window size to see the below d3.js chart updating itself. Discover how it works with code snippets here.