Step by step
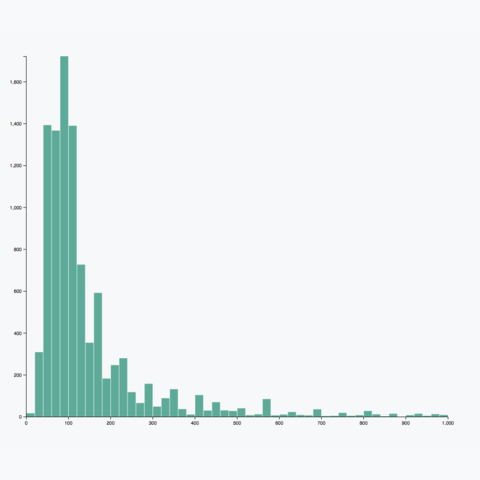
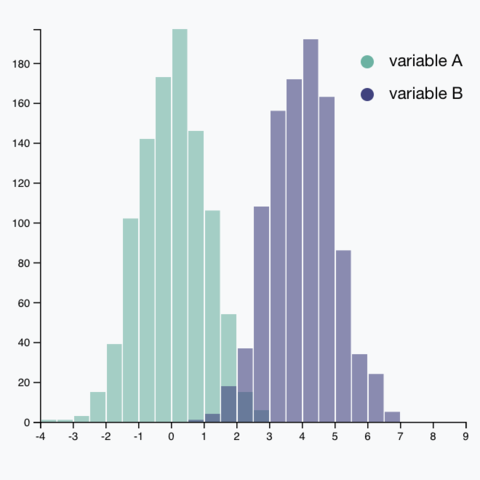
Learn how to build a basic histogram and how to apply a few customizations to it. Starts easy with only one data series and gets harder with several, color highlighting, mirroring and more.
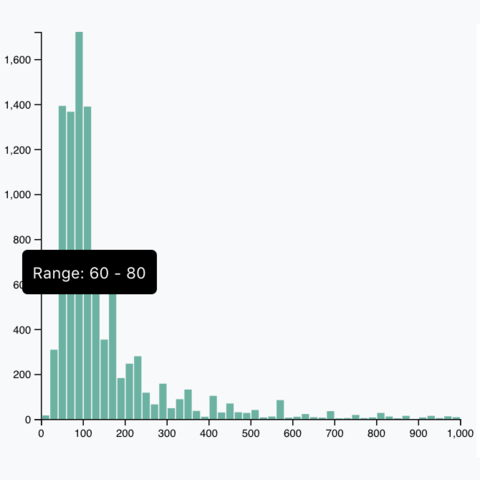
Interactive
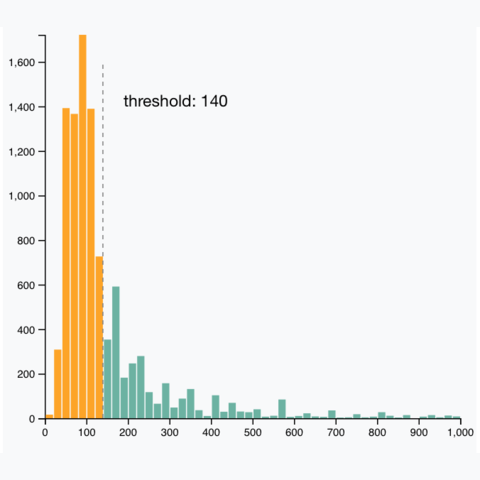
Interactivity on histograms can be interesting for 2 main reasons. First, playing with the bin size is an important step: the distribution can look very different depending on the value as explained here. Second, adding a tooltip to display bar threshold and exact number of values can be a plus.