A note on input data format
Building an arc diagram requires information on nodes and
links. This information can be stored in many different format
as described
here.
Json format is the most convenient way to work with
d3.js and looks basically like that:
{ "nodes": [
  { "id": 1, "name": "A" },
  { "id": 2, "name": "B" }
],
"links": [
  { "source": 1, "target": 2 }
]}
It is unlikely that your data are currently at this format. You
probably need to reformat your data first using another
tool like R. The
following document
gives a few example on how to reformat the most common types of
input to get a json file.
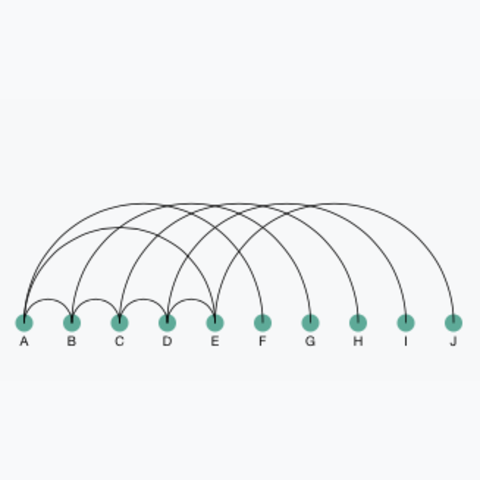
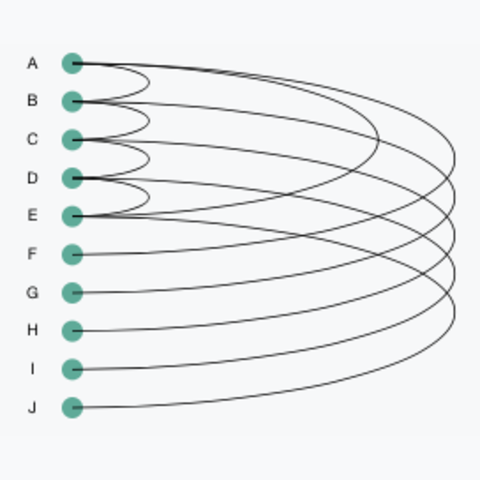
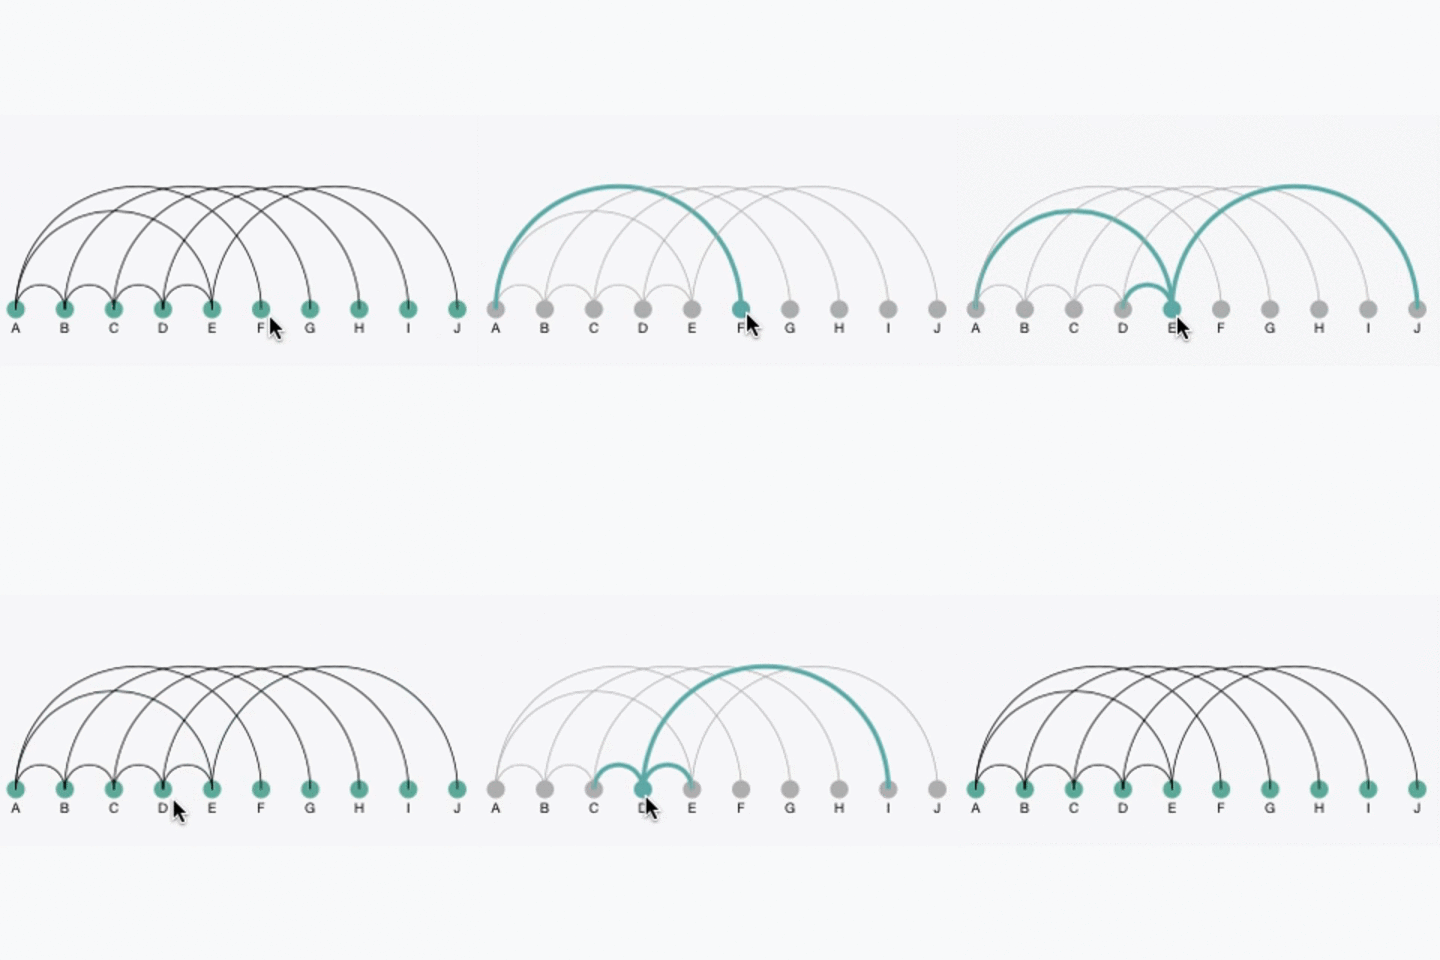
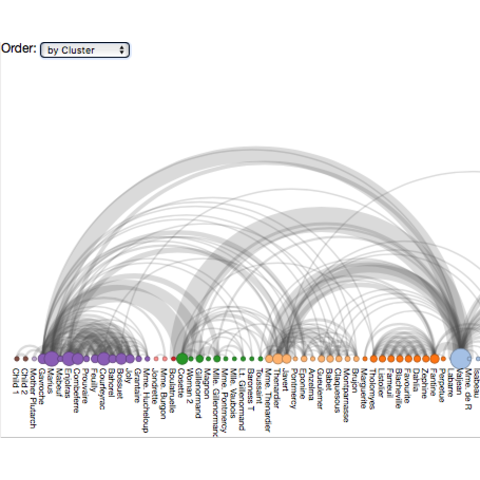
The following most basic arc diagram will guide you through the core steps of this chart. Next charts show how to turn it vertical and how to highlight links on hover.
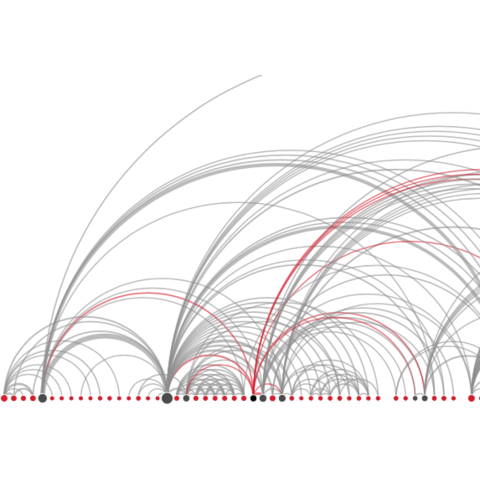
Here is an arc diagram showing the relationships between researchers. One node is drawn for each researcher having published at least one paper with my previous supervisor, Vincent Ranwez. Two researchers are linked if they co-authored at least one paper together. Read more about this dataset here.
Hover nodes for more info
See codeA few blocks with more complicated codes to showcase what's possible to do with arc diagram.
