Step by step
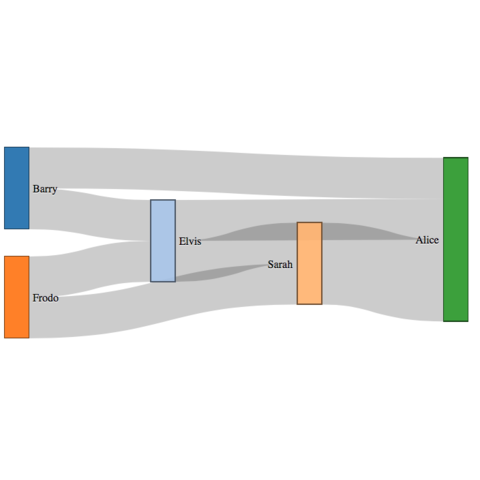
Sankey plots are built thanks to the
d3-sankey plugin. Input
data must be a nested list providing the nodes and the
links of the network. This kind of data can be stored
under several formats: this section shows how to build a sankey
diagram from a few different ones.

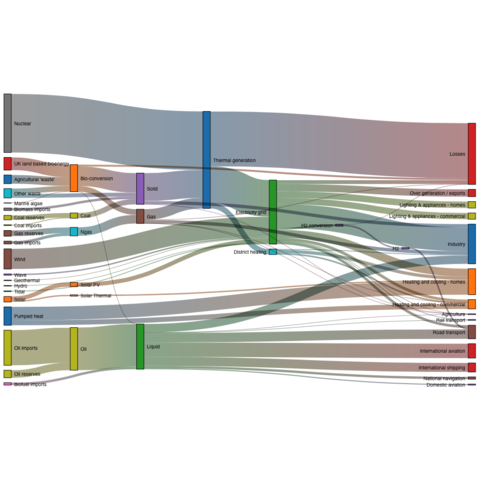
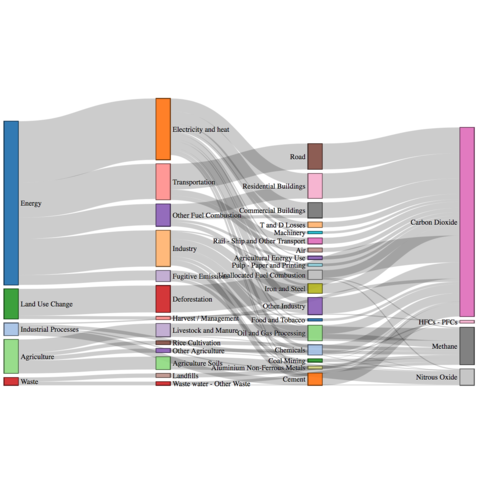
Selection of blocks
A few blocks with more complicated codes to showcase the possibility
of the d3-sankey plugin