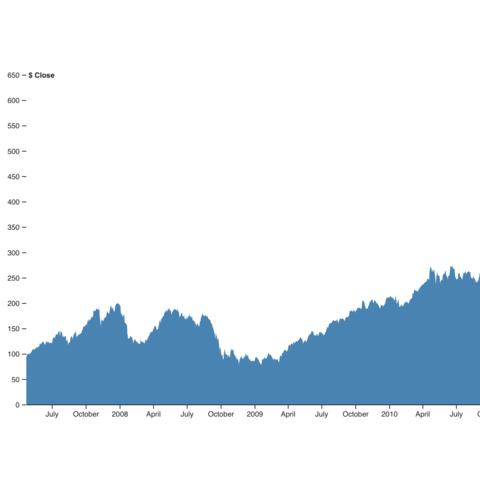
Building an area chart relies on the d3.area() helper
function. If you're not familiar with it, have a look to
shape section of the gallery to
understand its basics. Then follow the examples below to put it in
practice.
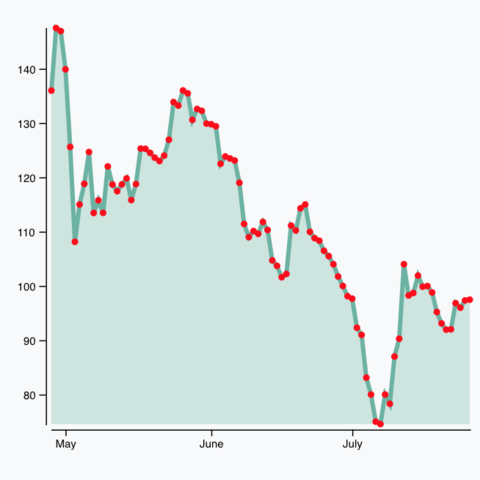
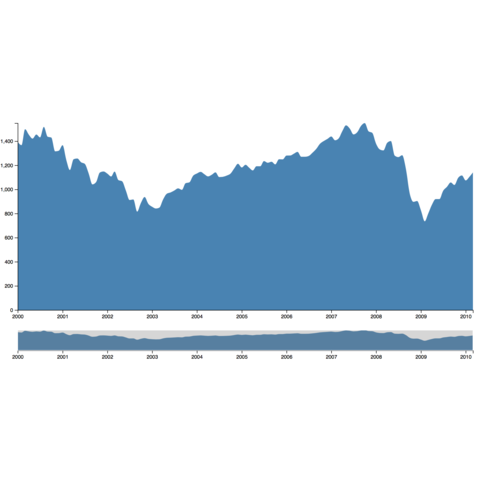
The most common use of interactivity for area chart is the zooming feature. It is usually done through brushing on the X axis, or using a control panel at the bottom of the main chart.
Note: Another common problem is to switch between dataset. This
is extensively described in the
line chart section. You just have to replace
d3.line by d3.area() to get the same
features.
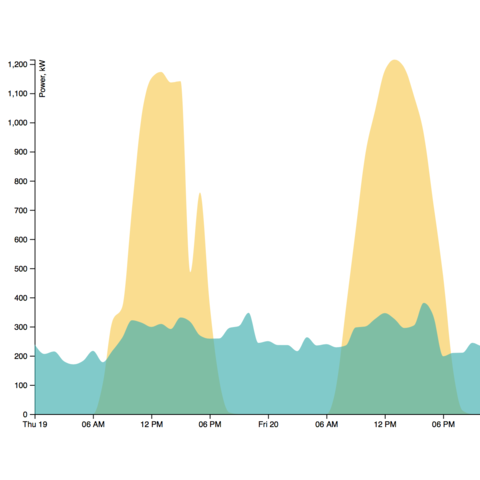
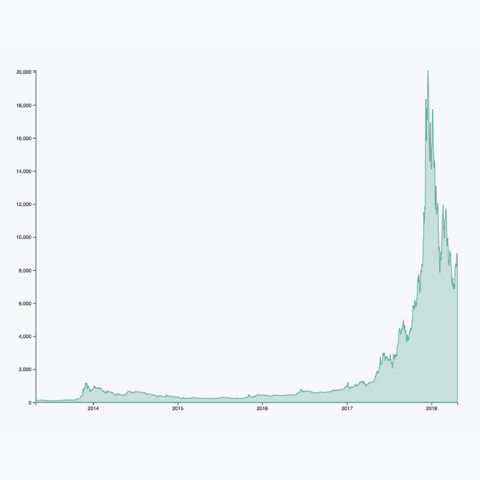
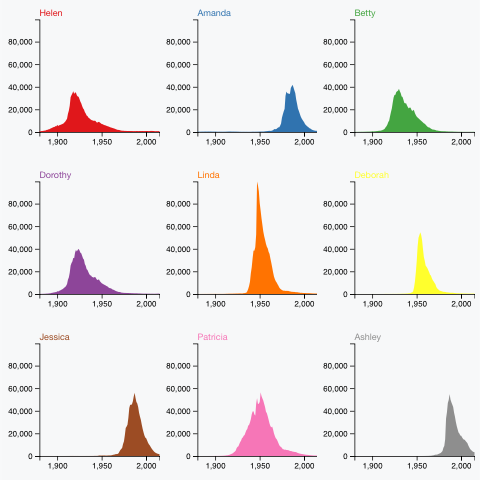
A few blocks with more complicated codes to showcase what's possible to do with area charts