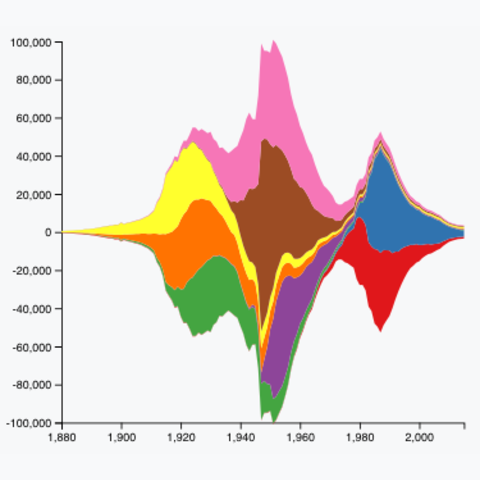
Step by step
Building a streamgraph follows the same process than for a
stacked area chart. Stack the data with
the d3.stack() function, but use the
stackOffsetSilhouette offset to position shapes around
the central axis.
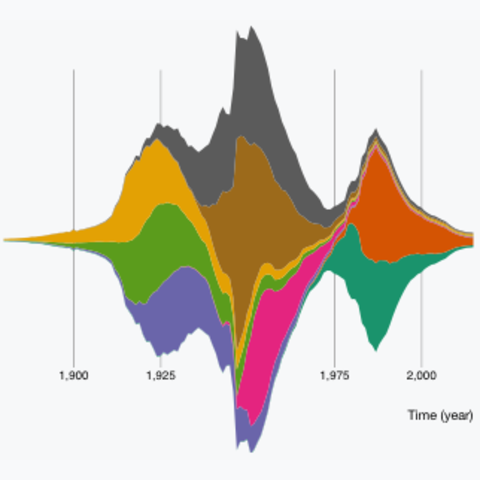
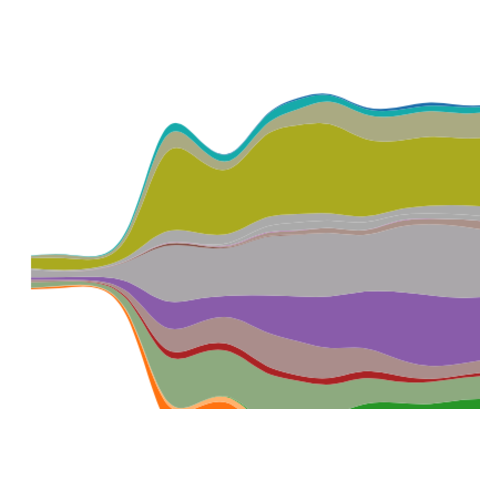
Template
Here is a streamchart showing the evolution of a few baby names in the
US during the previous century.
Read more
about it here. Axis are customized, color palette is used, hover
feature is added.
Hover a group to get the name.
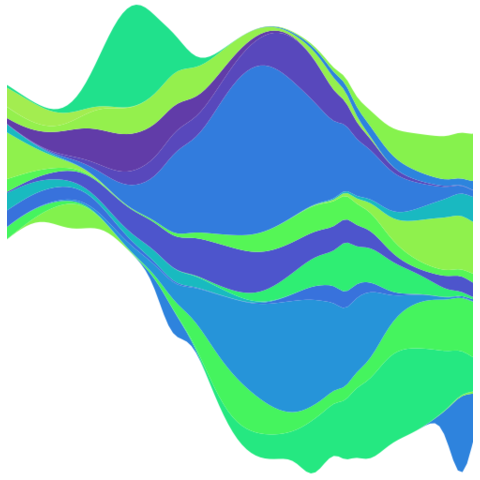
Selection of blocks
A few blocks with more complicated codes to showcase the possibility of d3 for streamgraphs.