Circular barplot


This is the circular barplot section of the gallery, a variation of the well known barplot. Note that even if visually appealing, circular barplot must be used with care since groups do not share the same Y axis. It is very adapted for cyclical data though. Visit data-to-viz.com for more info on this type of chart, or check the examples below to learn how to implement it in d3.js.

Step by step

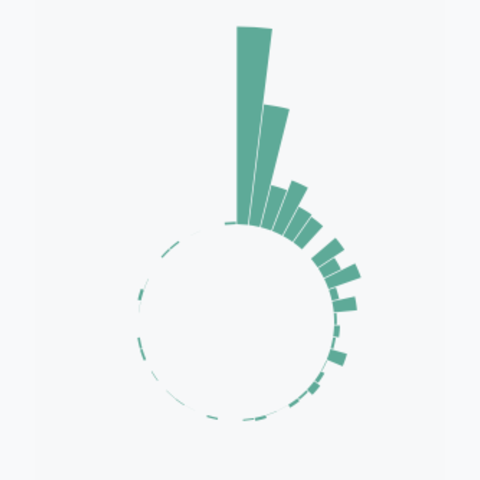
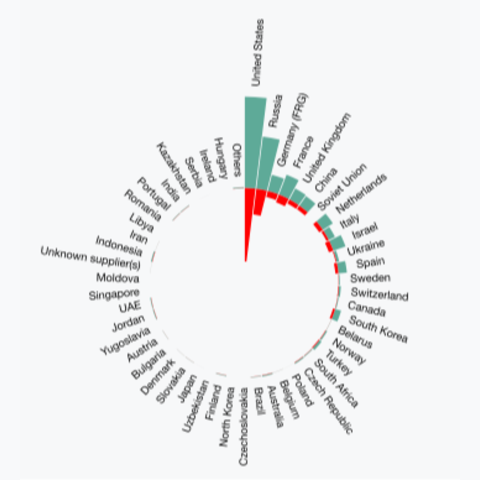
Here is a set of examples leading to a proper circular barplot, step by step. The first most basic circular barchart shows how to take advantage of the d3.scaleRadial() function to display bars around a circle. Once this concept is understood, it is relatively straight forward to 
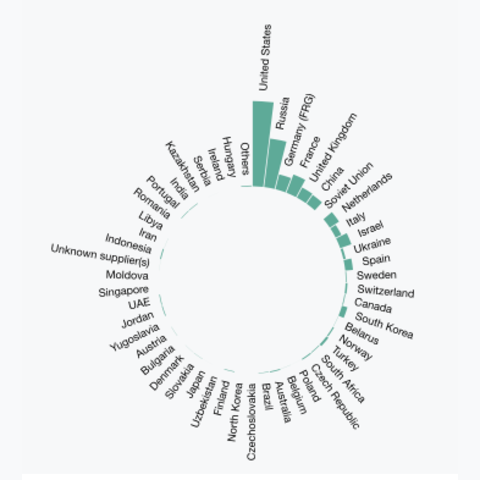
add labels or another series of bars.


Selection of blocks

Related chart types


Barplot
Spider / Radar
Wordcloud
Parallel
Lollipop
Circular Barplot