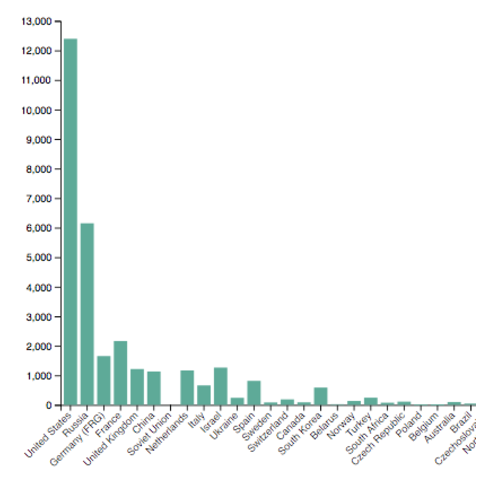
Building barplots in d3.js relies on the addition of several
rect, one per group in the categorical variable. The
first example below should
guide you in this procedure. Note that
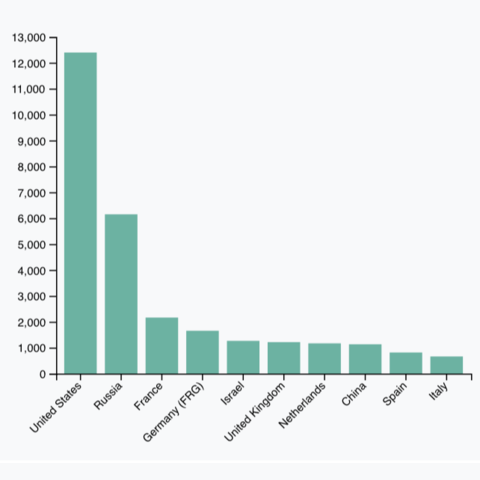
ordering groups
is an important step when building barplots.
This example explains how to
do it.
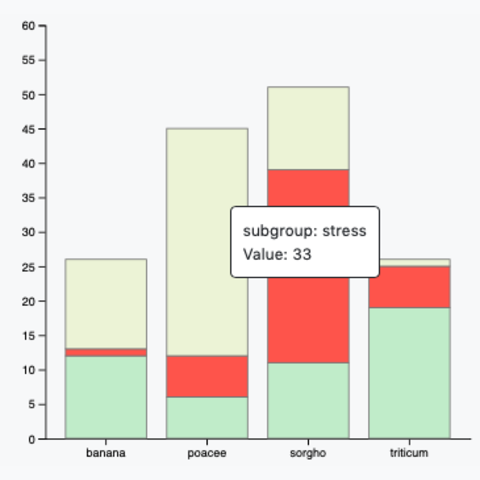
Due to its simplicity, barplot is a very good chart to understand the
basic concepts of interactivity.
Below are many examples illustrating how to deal with
transition, buttons, the
enter() function and more.
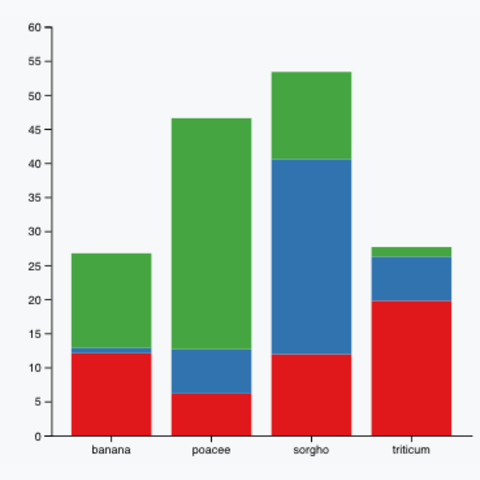
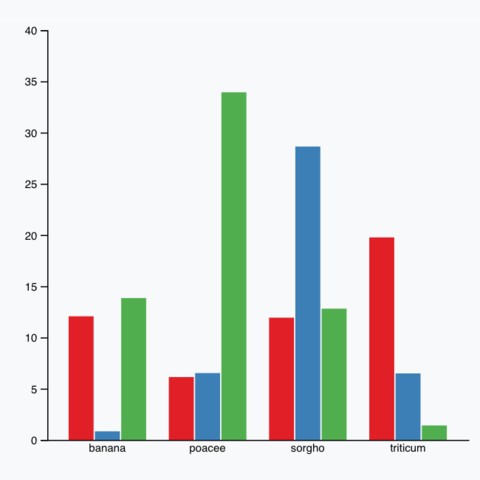
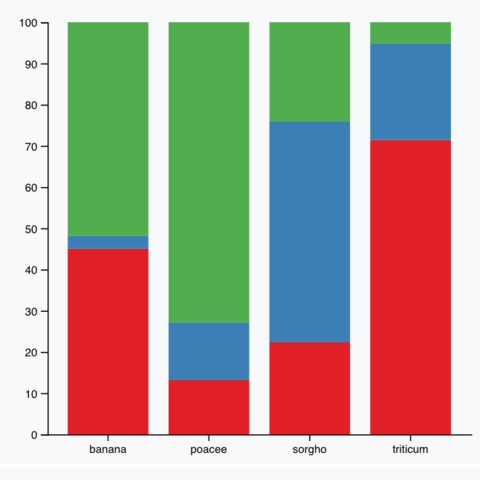
A barplot can also display values for several levels of grouping. Subgroups can be displayed one beside each other, giving a grouped barplot. If subgroups are displayed on top of each other, it is a stacked barplot.