It is of importance to understand that a connected scatterplot is basically an hybrid between a scatterplot and a lineplot. Thus, please visit the related section here and here to get more examples, since the techniques used are very similar.
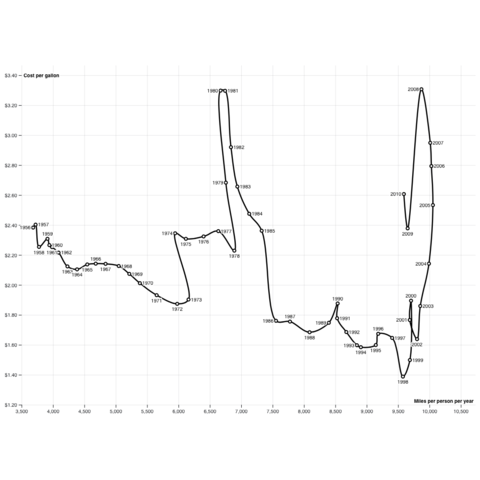
Please note also that 2 types of connected scatterplot exist. The first is simply a lineplot with dots added on top of it. It takes as input 2 numeric variables only. The second shows the relationship between 2 numerical variables across time. It requires 3 numerical variables as input. Confusing? Visit data-to-viz to clarify.
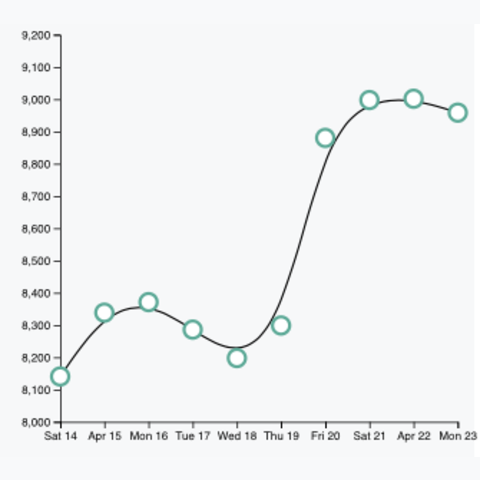
Pretty straightforward once you understood how to build a scatterplot and a lineplot. See the focus on annotation that is handy for the second type of connected scatter (see above).
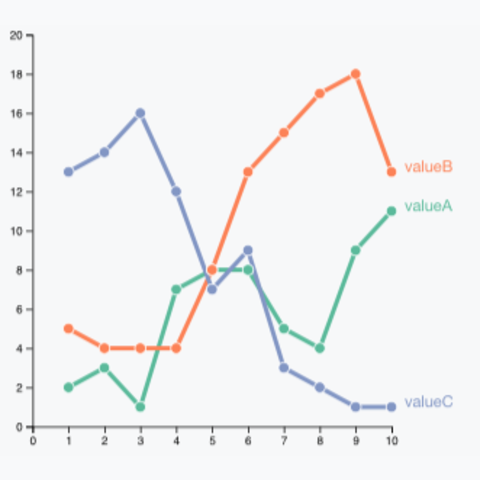
Tooltip is usually the most desired interactive feature for connected scatterplot. The ability to swap from one group or dataset to another is also frequently used. Zooming is not necessary in general, see the line plot section for that.
A selection of the best blocks to illustrate what you can do with connected scatterplot in d3.js
Related chart types