Step by step
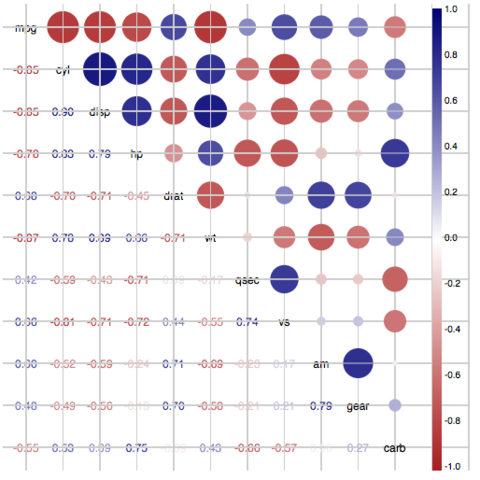
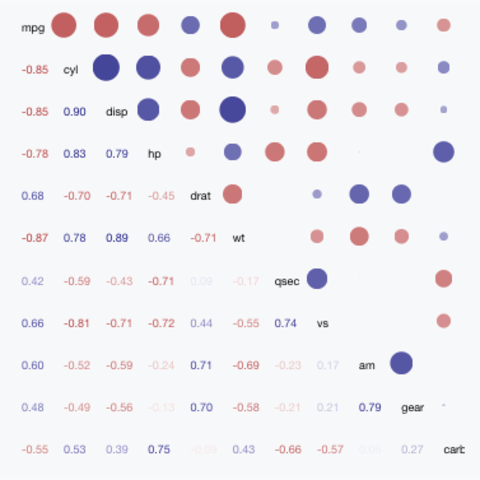
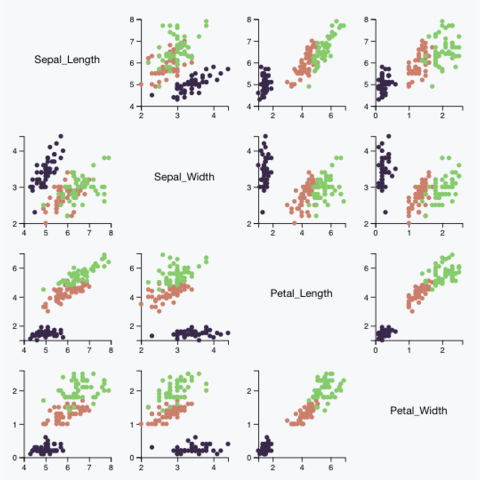
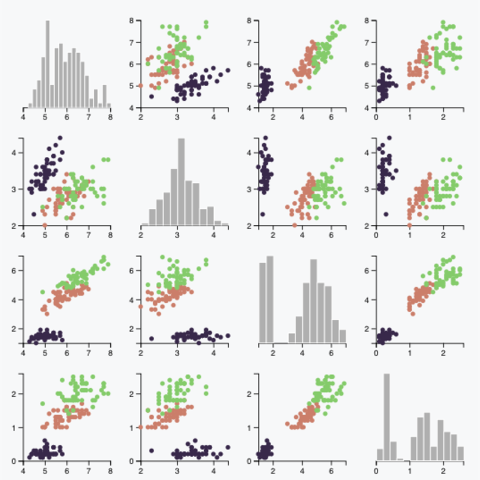
In a correlogram, the relationship between each pair of variable is visualised through a scatterplot, or a symbol that represents the correlation (bubble, line, number..). The diagonal often represents the distribution of each variable, using an histogram or a density plot.
Selection of blocks
Not many blocks are available for correlogram. It makes sense, since correlogram are more used for exploratory analysis than for explanatory purposes (read more). Thus, they are not often build using d3.js