Step by step
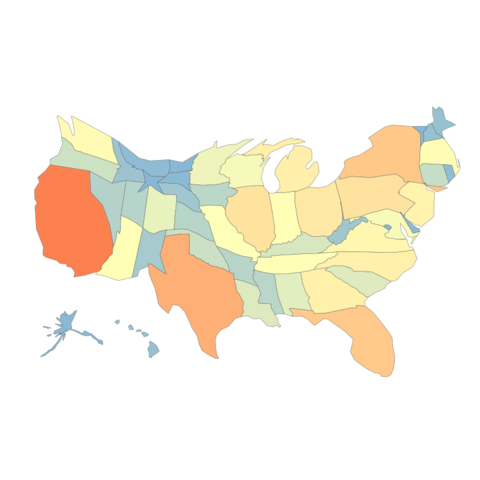
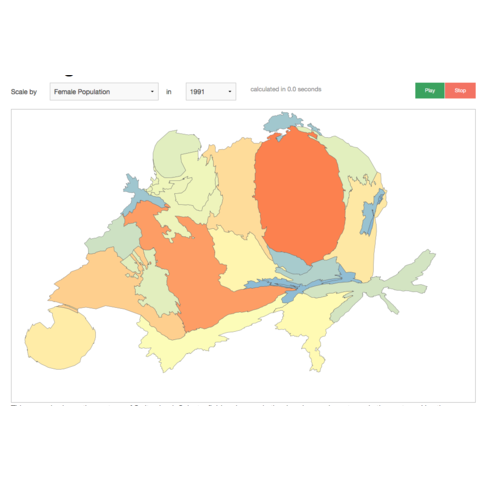
The most popular way to build a cartogram with d3 is the topogram library built by Shawn Allen. It relies on a algorithm to construct continuous area cartograms by A. Dougenik et al. The following examples should guide you through its basic usage.

Selection of blocks
A few blocks with more complicated codes to showcase what's possible to do with connection maps. First show how to display connections on hover. Second show how to apply edge bundling to the connection to declutter the chart.